Plot Software
Advertisement
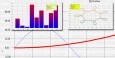
ADSS.Plot Control
With this control You can: Draw lines just from arrays. Use gradients to fill lines colors. Draw histograms just by passing two arrays with values. Change look of plot control. Make custom labels for axises. Allow to move and
Advertisement
Contour Plot for Excel v.1.01
Create real contour plots in Excel using any data (rectangular, nearly rectangular, or irregular data).
EZplot v.1 1
EZplot is an Excel add-in and trademark of Office Expander. The software design is targeted to improve productivity in creating Excel plots and performing data calculations in Microsoft Excel (from the Microsoft Office Suite).
EZplot for Excel v.1.01
EZplot is a plotting and data calculation computer software which enhances Excel. EZplot improves productivity by easily creating many plots in seconds. Plots are defined with parameter names instead of requiring manual selection of data.
DPLOT95 v.1 3
DPLOT95 is a software for creating and manipulating graphs in 1, 2, 3, and 4-D. With its help you you can create presentation-quality graphs as well as contour plots of 3-D and 4-D data while using data from a variety of sources.
Quiz Me! v.1.0
Test your knowledge with this simple quiz program. Quiz Me! is a small but extensible quiz software that can include images and choice questions that require either single or multiple answers. Two question sets are provided,
Multy_Y v.1.01
Multiple Y axes plots are created from existing Excel Charts. Each Excel chart appears as a new Y axis on the Multy_Y plot. The plot is a picture that appears on a separate Excel Chart.
Creatures! v.1.2
An intuitive, interactive, and immersive food chain simulator. Creatures! is a fun, real-time simulator that allows students to learn the underlying principles of population dynamics. Creatures! recreates a world filled with three types of organisms:
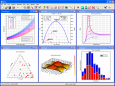
DPlot
DPlot is a general purpose graphing program designed for scientists, engineers, and students. It features multiple scaling types, including linear, logarithmic, and probability scales, as well as several special purpose XY graphs and contour plots of 3D
Bell Curve v.1.0
Introduce senior students to the Normal Curve. Bell Curve serves to introduce senior students to the Normal Curve.
EasyGraph v.1.0
Easy to Use Data Plotting Application. EasyGraph finally provides a simple, intuitive and fast way for students to learn the art of graph creation, modification and data representation.